Performance Analytics for Business Websites: How Small Business Sites Perform in 2026

If you’re here, you probably already have a sense of how unforgiving the realities of doing business online can be. Sometimes it’s not the competition, not the economy, but performance analytics that are the most relentless of all.
In this article, you’ll get a concise overview of how business websites perform when it comes to speed, what actually impacts their performance, and how you can outperform them using the right performance analytics. But first things first - let’s start with the basics:
Why website speed matters?
Website speed isn’t just a nice-to-have - it’s a critical factor that can make or break user experience and business results.
How critical? According to a Google study:
53% of mobile users leave a site if it takes more than 3 seconds to load.
As you can see, a slow website can cost you a lot. And, as the Portent study shows, a fast website can bring significant gains:
Conversion rates are 3x higher for ecommerce sites that load in 1 second.
Website speed affects not only the user experience - it also affects search rankings, engagement, and revenue. Every millisecond counts, and even small improvements can lead to significant gains in user satisfaction and business performance.
When is a website considered fast?
A fast website isn’t just one that loads a little quicker than the competition - it’s a site that feels instant to the user. From the moment someone clicks a link, they should see the page start to appear, be able to interact with buttons, scroll smoothly, and experience minimal layout shifts. Ideally, this happens within just 0–2 seconds, but speed is more than just a stopwatch metric.
Industry-standard measurements, like Speed Index, PageSpeed score, and Core Web Vitals, help quantify how quickly content becomes visible, how soon the page responds to user actions, and how stable the layout is during loading. These metrics form the foundation of effective performance analytics, which we’ll explore in detail later in the article.
Performance analytics snapshot: How fast are small business websites?
We analyzed over 3,300 small business websites in the US, covering a range of categories:
- Service businesses
- Online stores
- Restaurants
- Personal websites & portfolios
To better understand their speed, we measured each site using industry-standard metrics, which we'll explore in detail later in this post.
Speed Index
When asking “how fast is a website?" the intuitive answer involves a unit of time. One of the most widely used metrics is Google’s Speed Index, which measures how quickly content is visually displayed during page load. Lighthouse first records a video of the page loading in the browser and calculates the visual progression frame by frame. This gives a practical sense of the user experience rather than relying on abstract numbers.
According to Toolster’s study of The World’s Top 100 Websites:
The average web page load time is 2.5 seconds on desktop and 8.6 seconds on mobile.
How does this result compare to small business websites?
Average Speed Index on small business websites
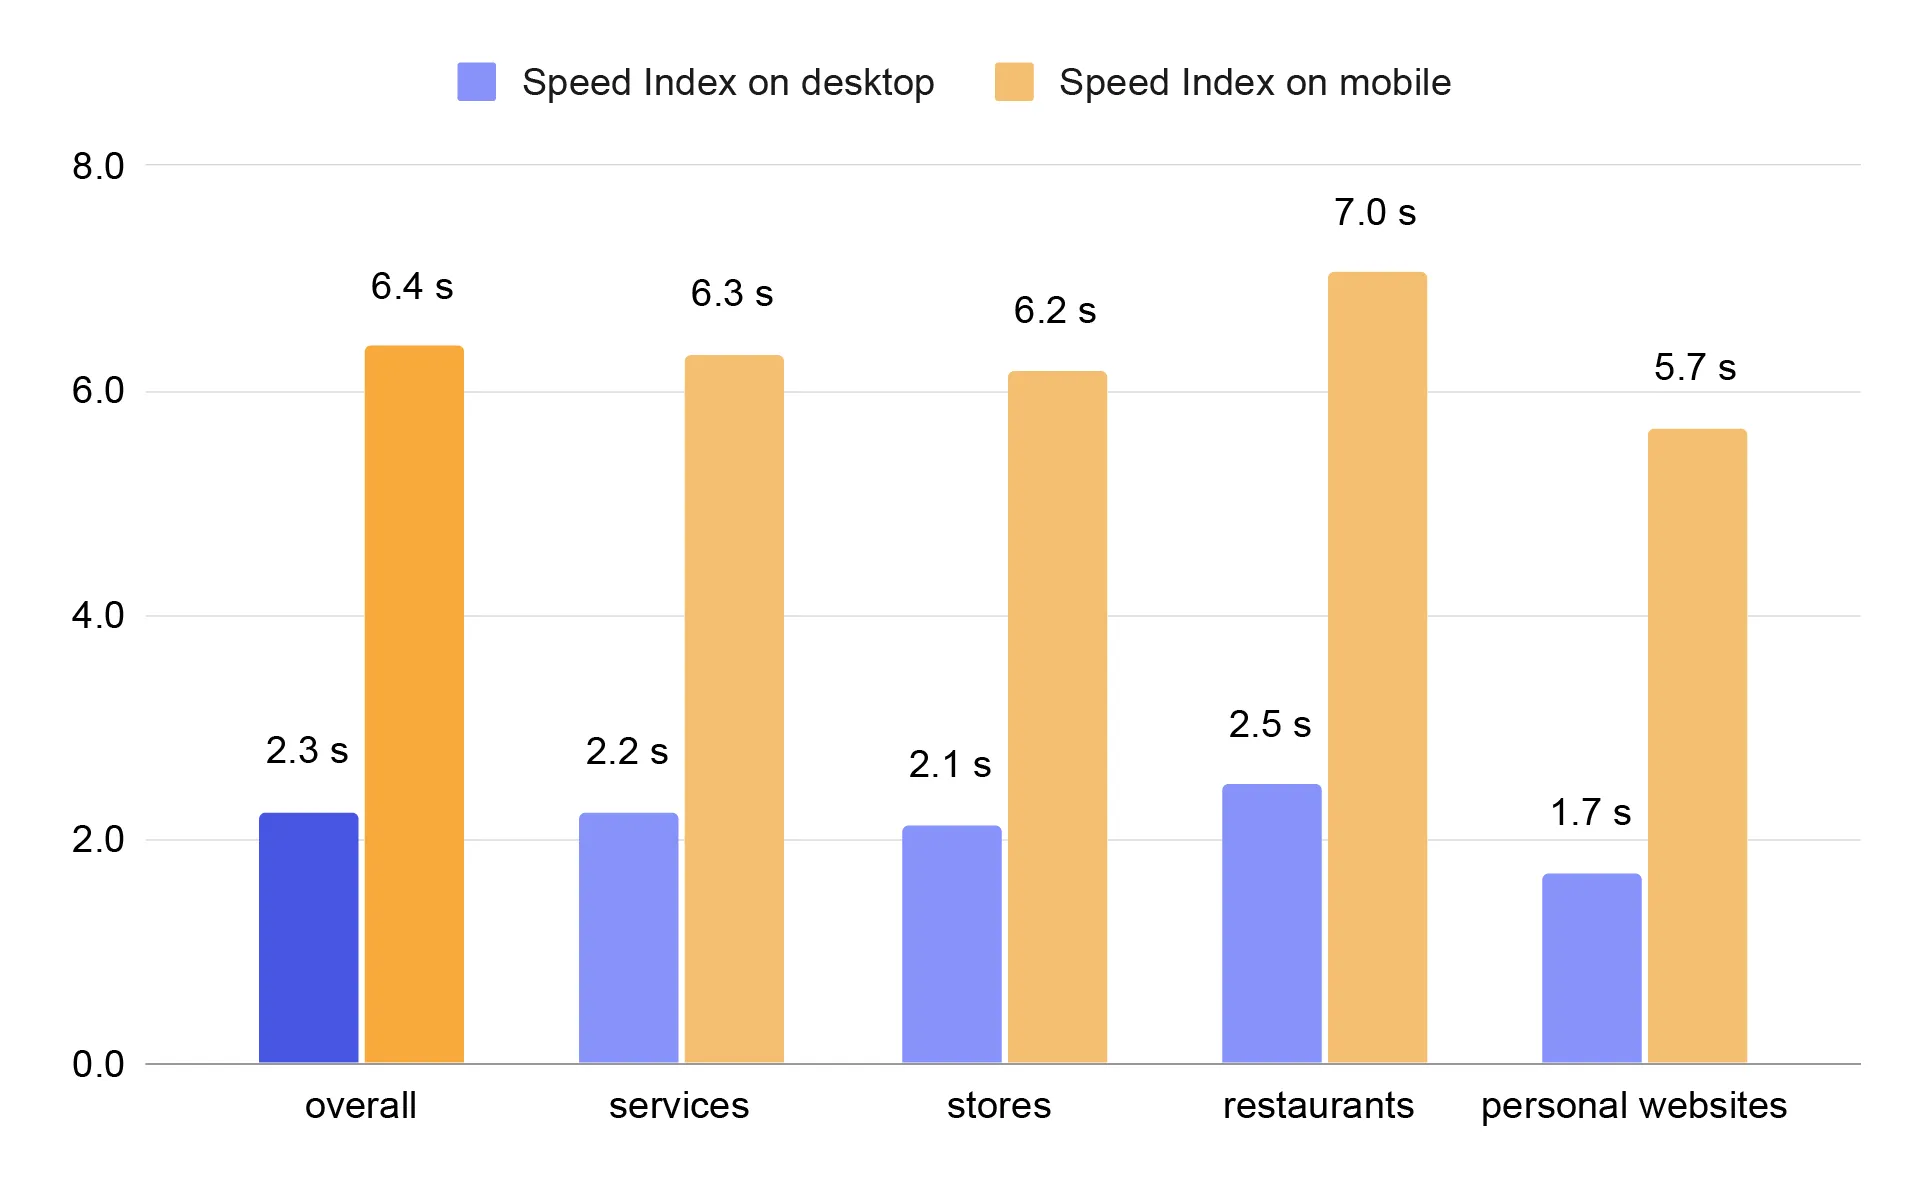
For small business websites in our study, the numbers looked like this:
- Overall: 2.3s desktop, 6.4s mobile
- Service businesses: 2.2s desktop, 6.3s mobile
- Stores: 2.1s desktop, 6.2s mobile
- Restaurants: 2.5s desktop, 7.0s mobile
- Personal websites: 1.7s desktop, 5.7s mobile
These results are slightly better than the Top 100 Websites, but do they qualify as “fast"?
Google classifies Speed Index as follows:
- Desktop: Good ≤1.3s, Average 1.3–2.3s, Poor >2.3s
- Mobile: Good ≤3.4s, Average 3.4–5.8s, Poor >5.8s
This gives a general idea of how small business websites perform, showing that personal websites tend to be faster, while restaurants often lag behind.
PageSpeed score
Speed Index alone doesn’t tell the whole story. Another widely recognized metric is Google PageSpeed Score, a 0–100 measure from PageSpeed Insights (using Lighthouse) that evaluates a webpage’s loading performance and optimization.
Score interpretation:
- 90–100: Excellent
- 50–89: Average
- 0–49: Poor
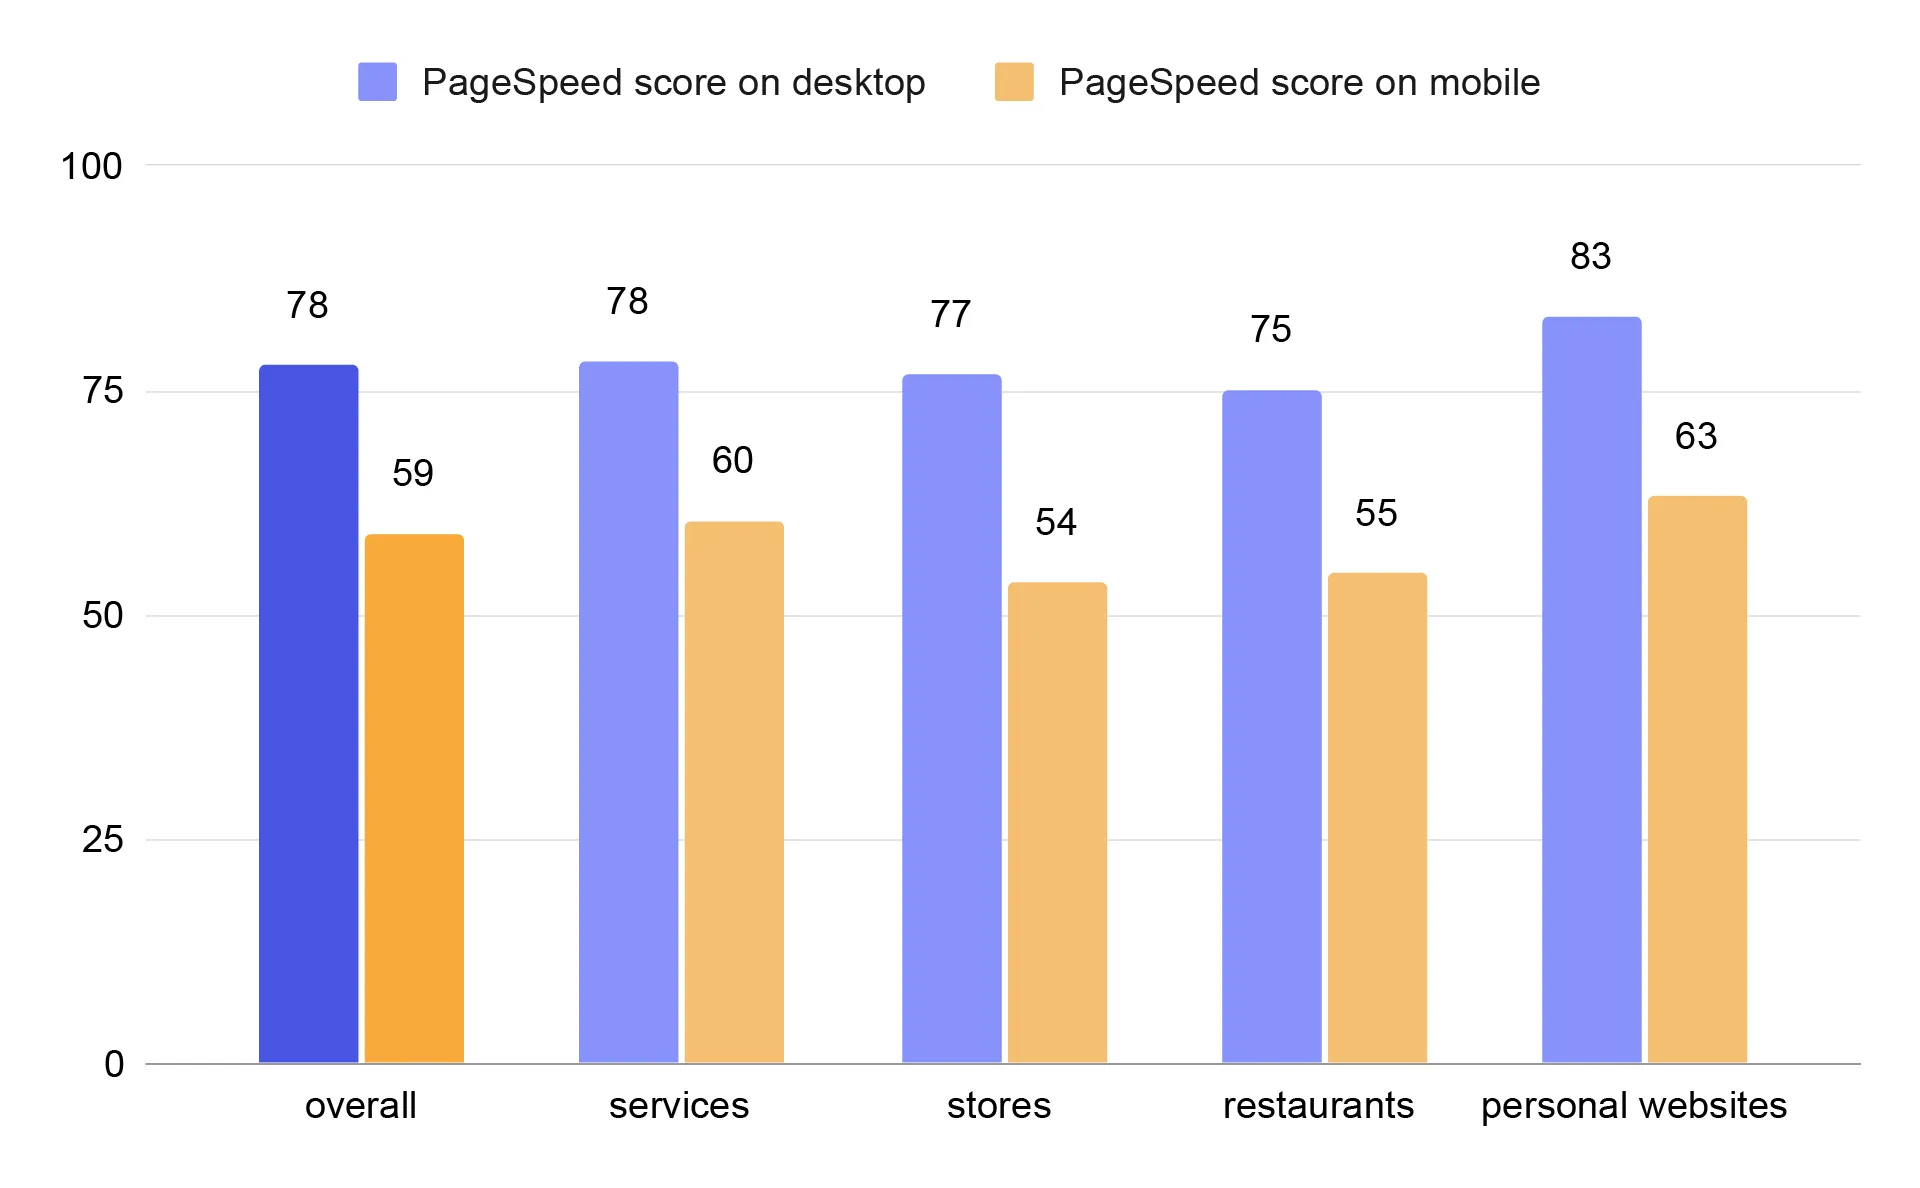
Average PageSpeed score on small business websites
In our dataset, small business websites scored on average 78 on desktop and 59 on mobile, with personal websites performing best and restaurants generally slower. This mirrors what we saw with Speed Index - mobile performance is consistently worse than desktop.
Core Web Vitals
PageSpeed Score includes Core Web Vitals, three key user-centric metrics developed by Google to measure speed, responsiveness, and visual stability:
- Largest Contentful Paint (LCP): Measures how fast the main content loads. Good LCP is ≤ 2.5s
- Interaction to Next Paint (INP): Measures responsiveness to user interactions. Good INP is ≤ 200ms
- Cumulative Layout Shift (CLS): Measures visual stability. Good CLS is ≤ 0.1
Passing Core Web Vitals is challenging.
Only 34% of the top 100 websites passed their Core Web Vitals and only 32.3% on mobile.
And how do the business websites do?
And how do the business websites do?
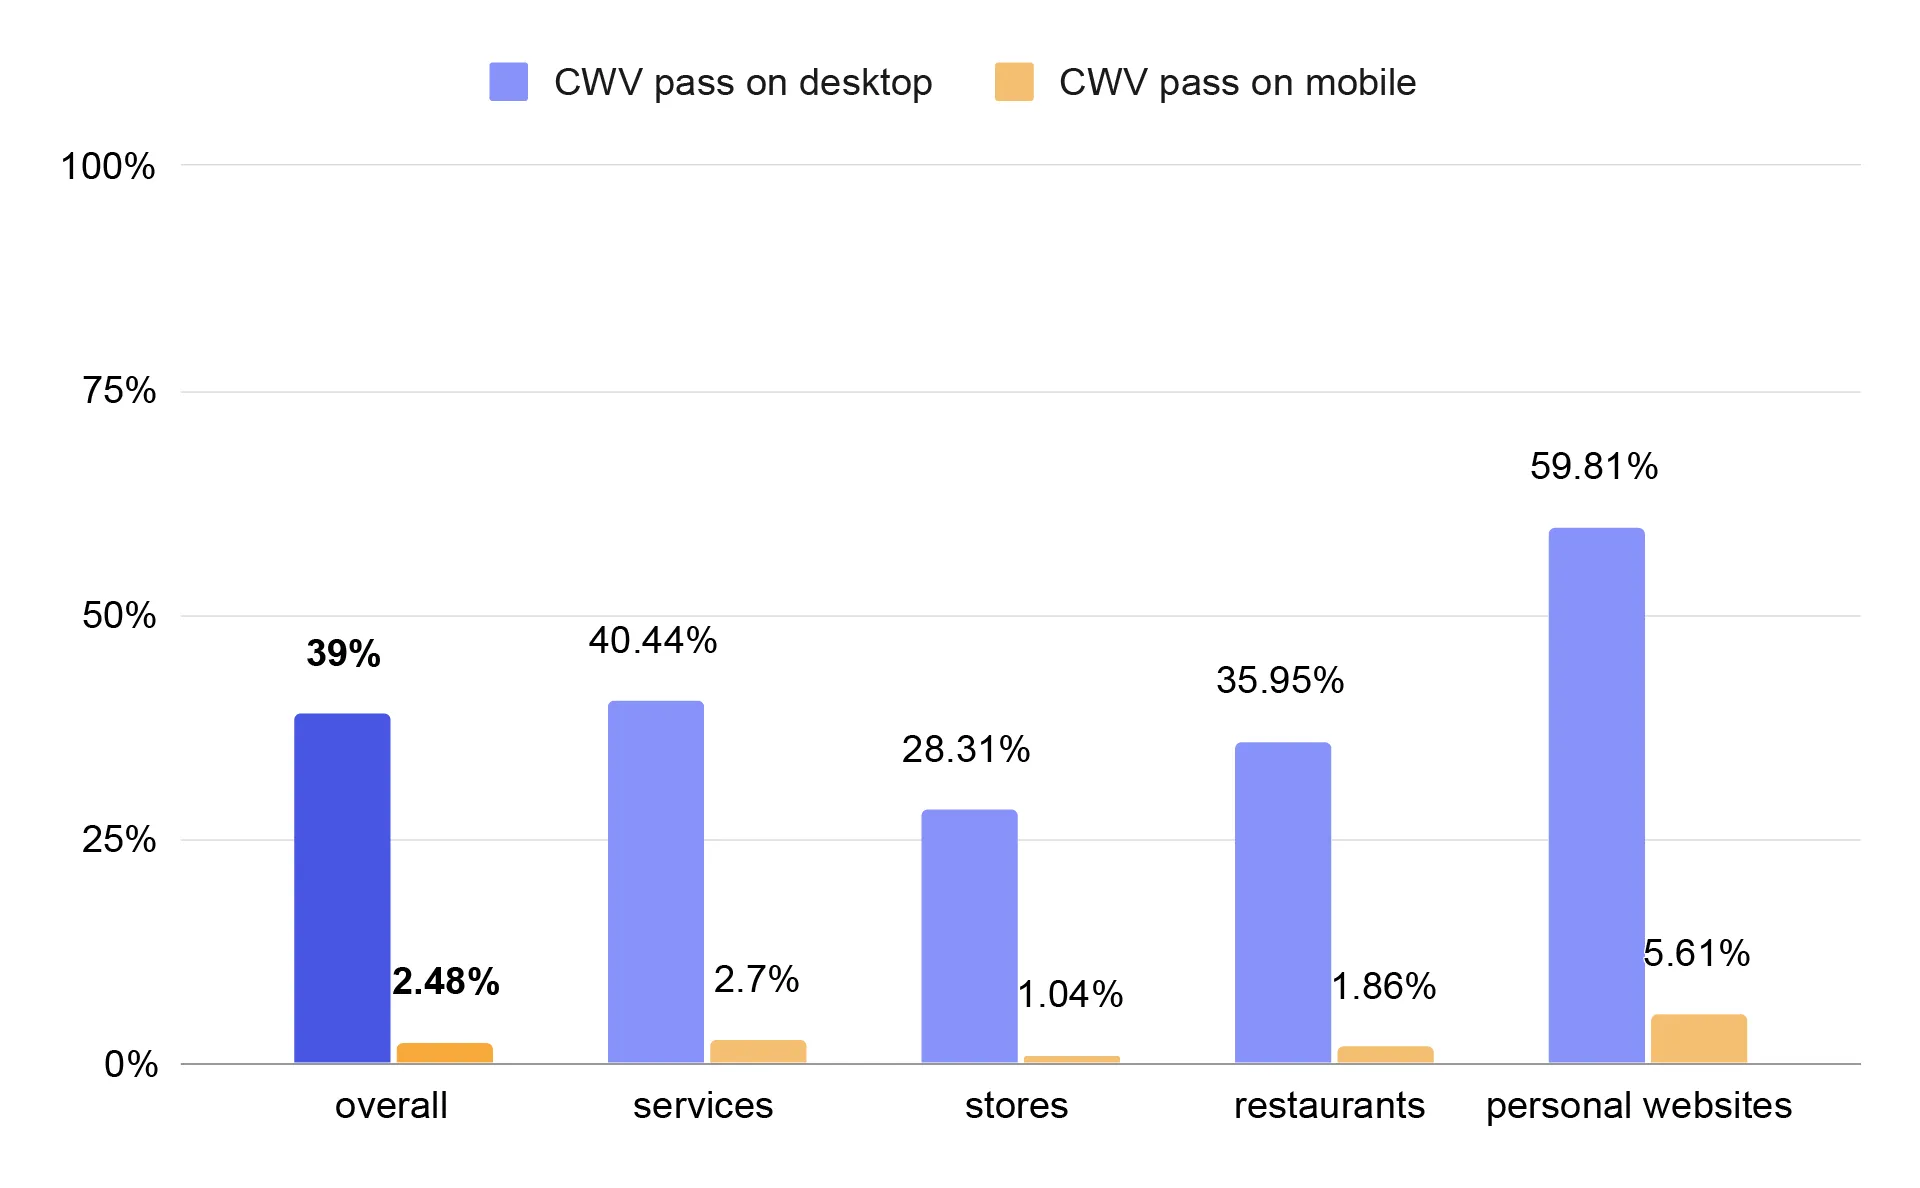
Percentage of business websites that passed Core Web Vitals
Across all business websites, 39% passed Core Web Vitals on desktop, and 2.48% on mobile. Personal websites performed the best, with 59.81% passing Core Web Vitals on desktop and 5.61% on mobile. Stores performed the worst, with only 28.31% passing on desktop and 1.04% on mobile. Personal websites probably perform better because they are simpler, lighter, and often custom-built, while online stores struggle due to heavy CMS templates, numerous plugins, and complex dynamic features that slow down loading and interactivity.
These findings highlight how deeper performance analytics can uncover structural weaknesses - especially in mobile environments. Now it’s time to take a closer look at what affects website performance in terms of speed - and maybe uncover why these differences exist.
What affects website performance?
Website performance is influenced by many different factors. Below are the most important ones:
🖼 LCP – Largest Contentful Paint
LCP shows how quickly the main content of a page appears — usually a large heading or a hero image. This metric is heavily influenced by server response time, image loading strategy, and render-blocking CSS. When LCP is slow, users see a blank or incomplete screen for too long - and even strong results in other metrics won’t fully save your PageSpeed score.
⛔ TBT – Total Blocking Time
TBT describes how long the page is “busy" executing JavaScript and unable to respond to user interactions. Large JS bundles, heavy frameworks, and third-party scripts (such as analytics tools or chat widgets) can effectively block the browser. In practice, the page may look loaded, but clicks don’t work - and that significantly lowers the score.
📐 CLS – Cumulative Layout Shift
CLS measures the visual stability of a page. If elements “jump" during loading, buttons shift, or text suddenly changes position, the CLS value increases. The most common causes are images without defined dimensions, ads, or fonts that load late. Even a fast-loading page can have a poor score if its layout feels unstable.
🎞 Speed Index
Speed Index reflects how quickly the page visually appears complete. It’s not about whether everything is fully functional, but whether users see meaningful content instead of a white screen. Fast HTML rendering, early CSS delivery, and placeholders (such as skeleton UI) can significantly improve this metric and make the page feel faster than it technically is.
⚡ FCP – First Contentful Paint
FCP marks the moment when the first visible element appears on the screen - text, background, or an image. It’s the first signal to users that the page is actually loading. FCP mainly depends on server speed, CSS, and font loading. A good FCP improves first impressions, although on its own it doesn’t guarantee a high PageSpeed score.
🌍 Server & network performance
Even the most optimized frontend won’t help if the server responds slowly. Time to First Byte (TTFB), CDN usage, caching, and modern protocols (HTTP/2, HTTP/3) form the foundation for all PageSpeed metrics. A slow backend automatically worsens LCP, FCP, and Speed Index.
🧩 Third-party scripts
Third-party scripts are one of the most common reasons for poor performance. Analytics tools, tag managers, consent pop-ups, and chat widgets often load early and block the browser. A single heavy script can reduce your PageSpeed score by several points - even on an otherwise technically solid website.
Why is website speed different on desktop and mobile?
Earlier in this article, you probably noticed the significant performance gap between desktop and mobile results. And it’s not a small difference. According to Tooltester:
Webpages on mobile take on average 70.9% longer to load than on desktop.
The difference in performance mainly comes from the conditions under which the page is tested. Mobile tests simulate slower devices and weaker network connections. That means the exact same code that runs smoothly on a desktop computer requires much more time to execute on a mobile device.
On mobile devices, JavaScript runs more slowly, which increases interface blocking and negatively affects interactivity metrics. In addition, websites often load different layouts and resources on mobile - such as larger hero images, mobile navigation menus, or sticky elements - all of which can delay the appearance of the main content.
Slower network speeds, hardware limitations, and energy-saving optimizations on mobile devices mean that every extra script or render-blocking CSS file has a much greater impact. That’s why a website that achieves excellent performance on desktop often performs significantly worse on mobile - even though technically it’s the same website.
How CMS shapes your site’s performance
The solutions used and adherence to best practices have a direct impact on website performance. With proper performance analytics, it’s clear how CMS usage correlates with passing Core Web Vitals. Knowing that 71.4% of websites use some form of content management software (W3Techs data), we examined how using a CMS correlates with passing Core Web Vitals.
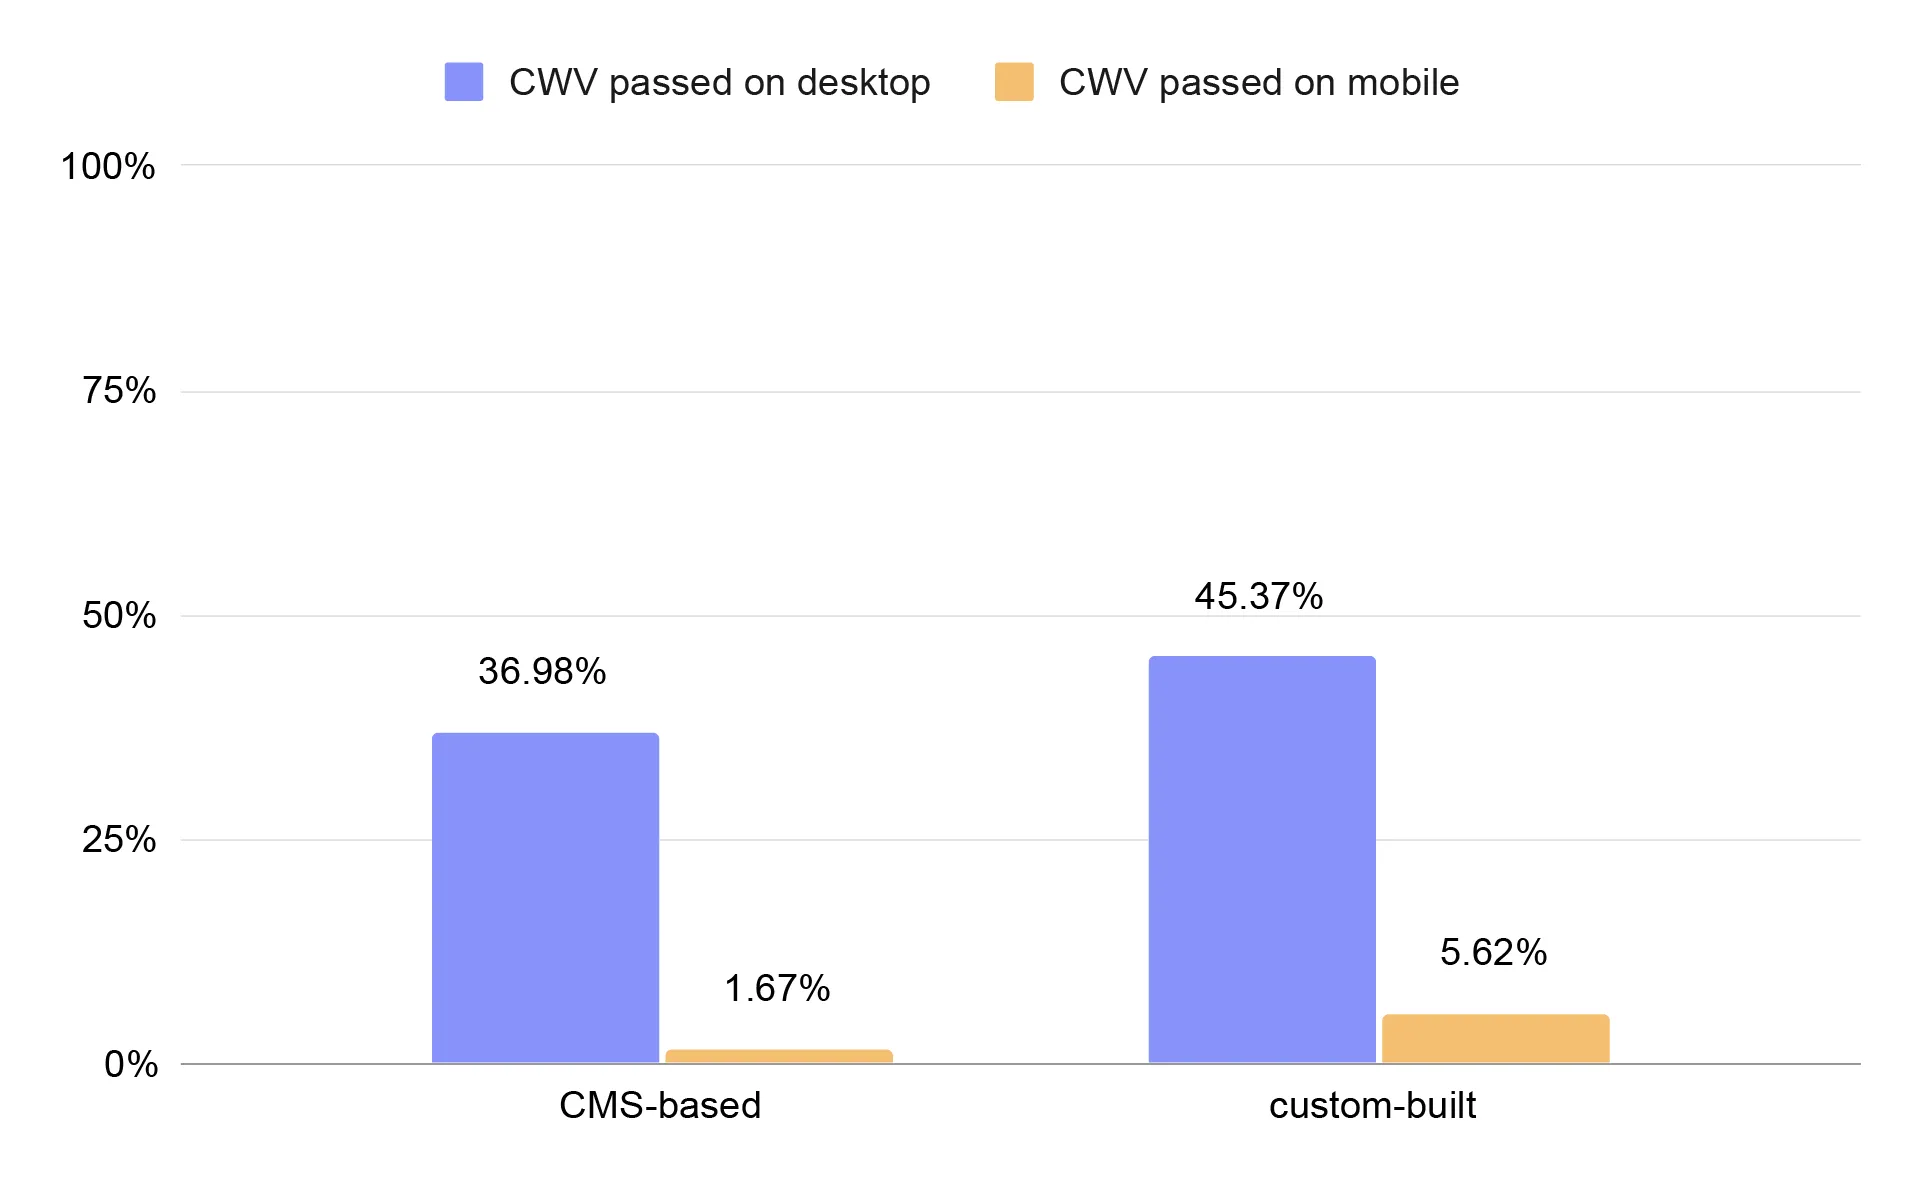
Percentage of small business websites passing Core Web Vitals, compared by CMS usage vs. custom-built sites
We observed a clear trend: websites built on a CMS are less likely to pass Core Web Vitals than custom-built sites.
CMS-based business websites pass Core Web Vitals on desktop 36.98%, and on mobile 1.67%.
Custom-built business websites pass Core Web Vitals on desktop 45.37%, and on mobile 5.62%.
CMS-based websites often show weaker CWV results than custom-built sites. This is not due to the CMS being “low quality," but rather the compromises required to make them universal and easy to use.
Common reasons include:
- Excess code: Themes and page builders load large amounts of CSS and JavaScript “just in case." Even if the site doesn’t use all features, the browser must download and process them, which worsens LCP and INP.
- Plugins and integrations: Every additional plugin adds scripts, requests, and potential main-thread blocking. On mobile, this quickly leads to high TBT and poor responsiveness.
- Limited technical control: CMSs impose HTML structure and resource-loading patterns. It’s harder to finely optimize the critical rendering path and avoid layout shifts.
- Weaker “out-of-the-box" infrastructure: Many CMS websites run on cheap shared hosting without proper cache configuration, negatively affecting TTFB and indirectly LCP.
- Legacy and architectural compromises: CMSs developed over many years contain historical solutions not designed for today’s performance metrics.
CMSs are designed to work for everyone, while custom-built sites are created for a specific purpose and architecture - making it much easier for them to meet Core Web Vitals requirements, especially on mobile.
Turning performance analytics into real competitive advantage
Website performance isn’t a technical detail - it’s a competitive differentiator. The data clearly shows that while many business websites perform “acceptably" on desktop, mobile performance is where most of them lose ground. And that gap is where the real opportunity lies.
If you want to outperform, focus on what actually moves the needle:
- Mobile-first performance - this is where most competitors underperform.
- Core Web Vitals stability - fast loading, responsive interaction, zero layout shifts.
- Lean architecture - fewer blocking scripts, optimized assets, controlled third-party tools.
- Continuous monitoring - performance is not a one-time fix, it’s an ongoing process supported by consistent performance analytics.
The advantage doesn’t go to the biggest brand - it goes to the fastest, most responsive experience. And while performance analytics help you understand where you stand, real impact comes from fixing the root causes - not just tracking the symptoms.
The good news? You don’t have to fight performance battles with plugins, patches, and endless optimizations. When your CMS and CRM are built with performance in mind, speed becomes part of the foundation - not an afterthought. Our websites are 2.6 times faster than an average small US-based business website - the average Speed Index of a website created with IKOL is only 0.87s on desktop.
You can experience that difference firsthand. 👉Test IKOL for free👈 to see how much faster and more responsive your website can become.
The data and statistics presented in this blog post come from a research study conducted by IKOL between 2023 and 2026. To learn more about IKOL research methodology and explore other findings, visit: ikol.com/research